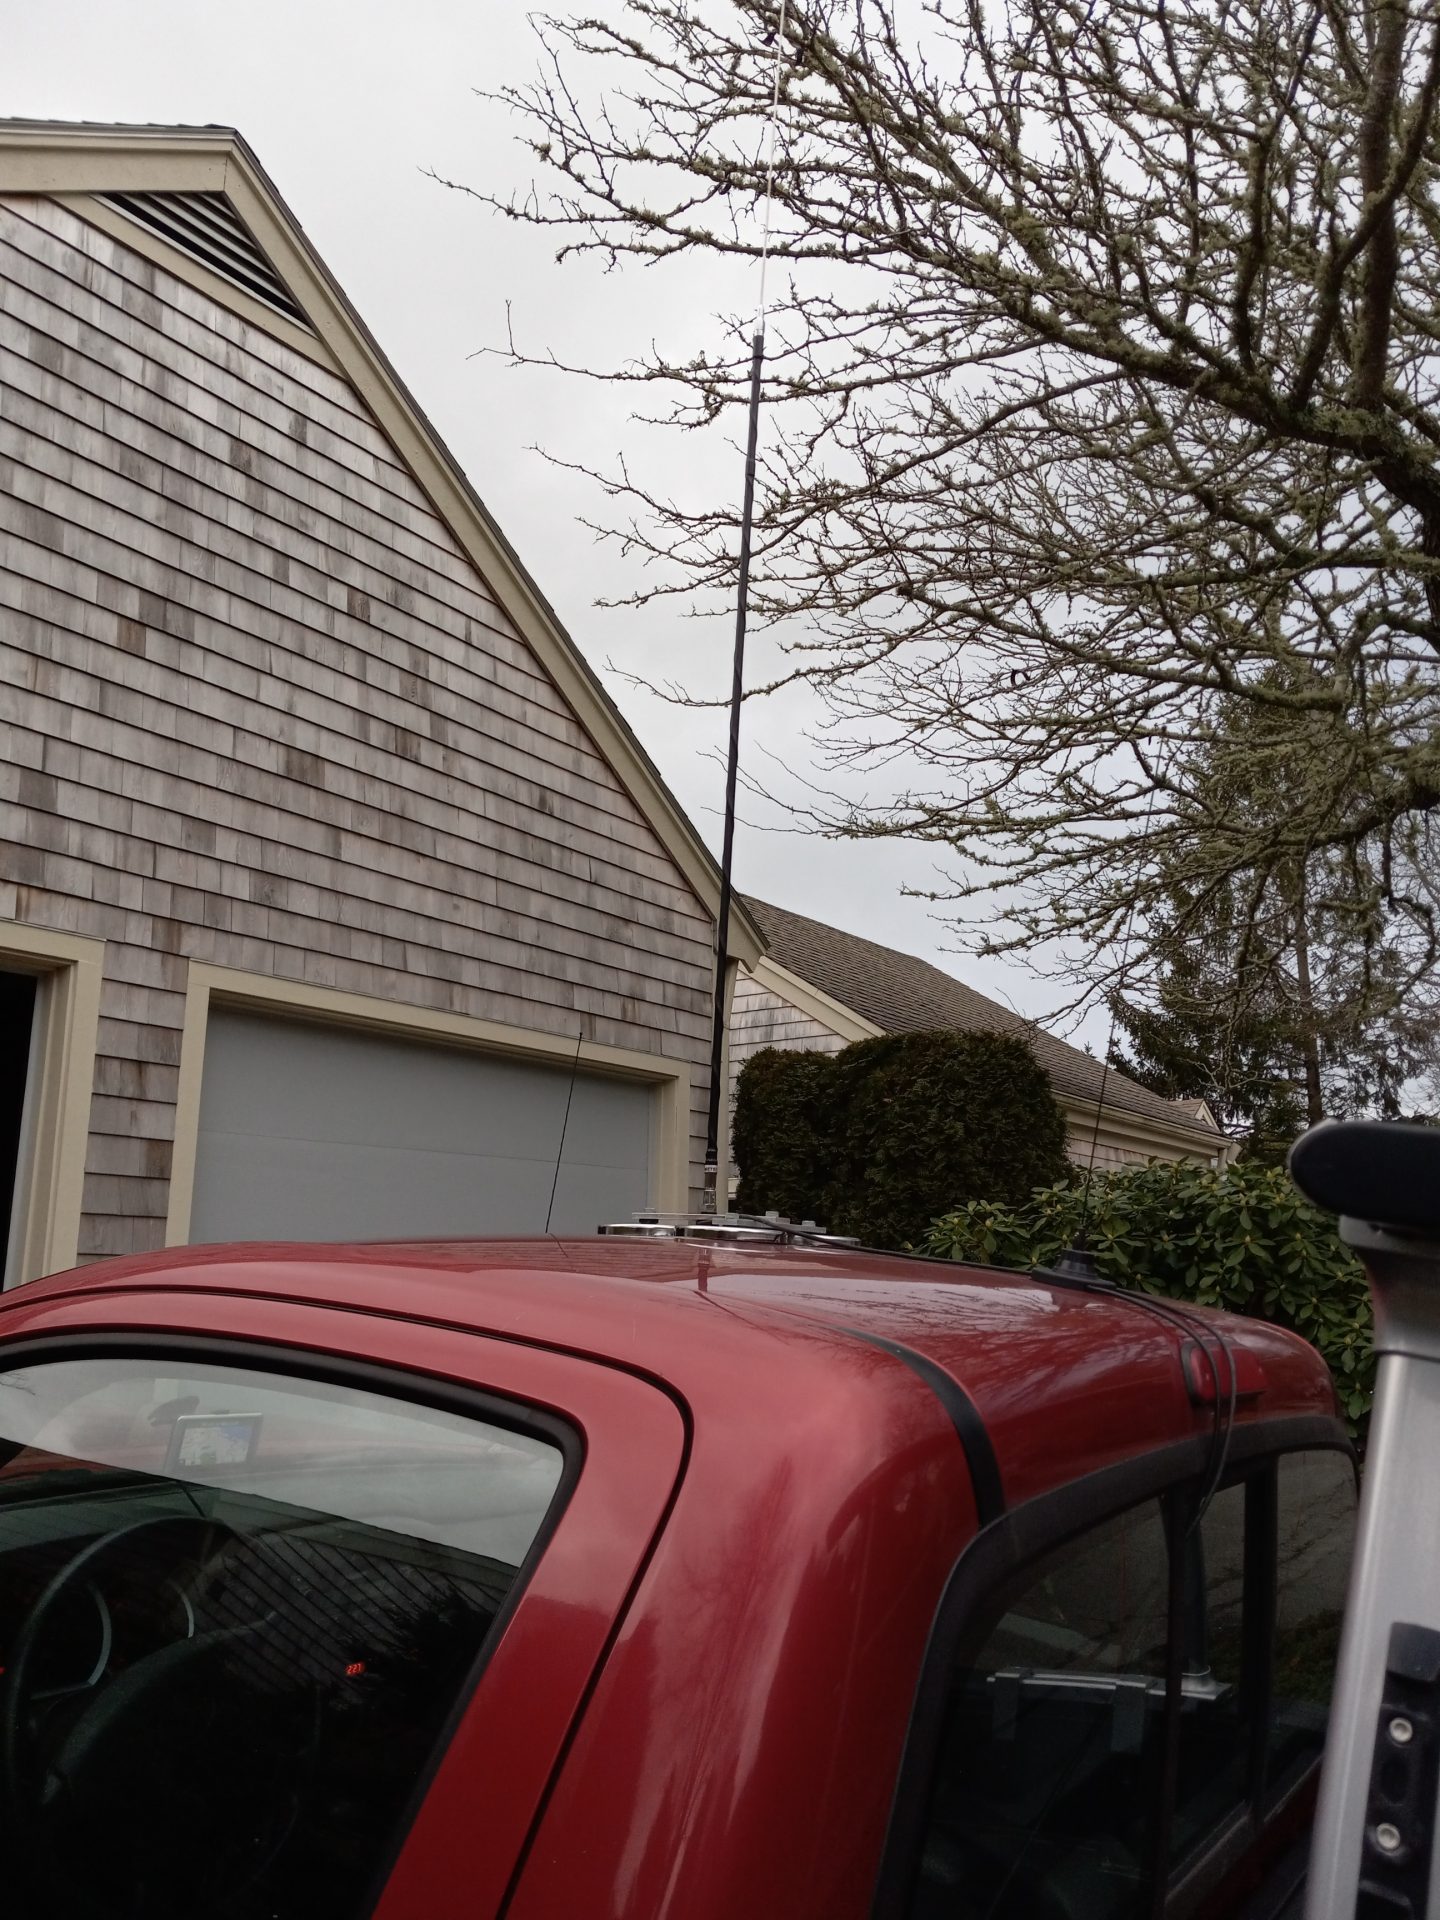
Jeff, W4DD, has created a Windows-based app that maps RFI from power lines as you drive along side them. I’ve been experimenting with the software to develop some guidelines for its use by the RFI teams. I know several others on the teams are doing the same thing. The Icom 705 in each team has both the GPS and CI-V capability to support gathering the required data. The process begins by installing the app, available on request, and creating a directory or folder to receive the data. The vehicle is then equipped with a Hamstick for 10 meters https://nediv.arrl.org/wp-content/uploads/2023/12/rfi-10m-antenna.jpg (I haven’t tried other bands but this is the one Jeff recommends) and a team Icom 705 is connected via a micro-usb port on the 705 and a usb port on a laptop that has the Icom drivers installed on it (available on the Icom America website.) https://nediv.arrl.org/wp-content/uploads/2023/12/rfi-test-setup.jpg I’ve installed several ferrites (available on Amazon) on the usb cable to suppress the usb port noise when in operation. If all is connected properly, starting the RFID software displays that the GPS and the CI-V S-meter reading from the Icom 705 are recognized.
I tune the Icom 705 to 28.5 MHz in the AM mode. Start the data gathering process by providing a name for the file when requested. Start driving the test route at about 30 MPH paying attention to traffic so you don’t become the lead car in a caravan. At this point I strongly recommend that you work with a partner so you can drive and not need to pay attention to the data being recorded. The faster you drive, the further apart the data points become so you can cover more territory but you may miss the detailed location of an RFI source. You can zoom in on a particular area of the map and examine it in Google Earth to gather more detail. If you are hunting a real source, you may want to repeat a run. It is helpful to have a spare laptop battery.
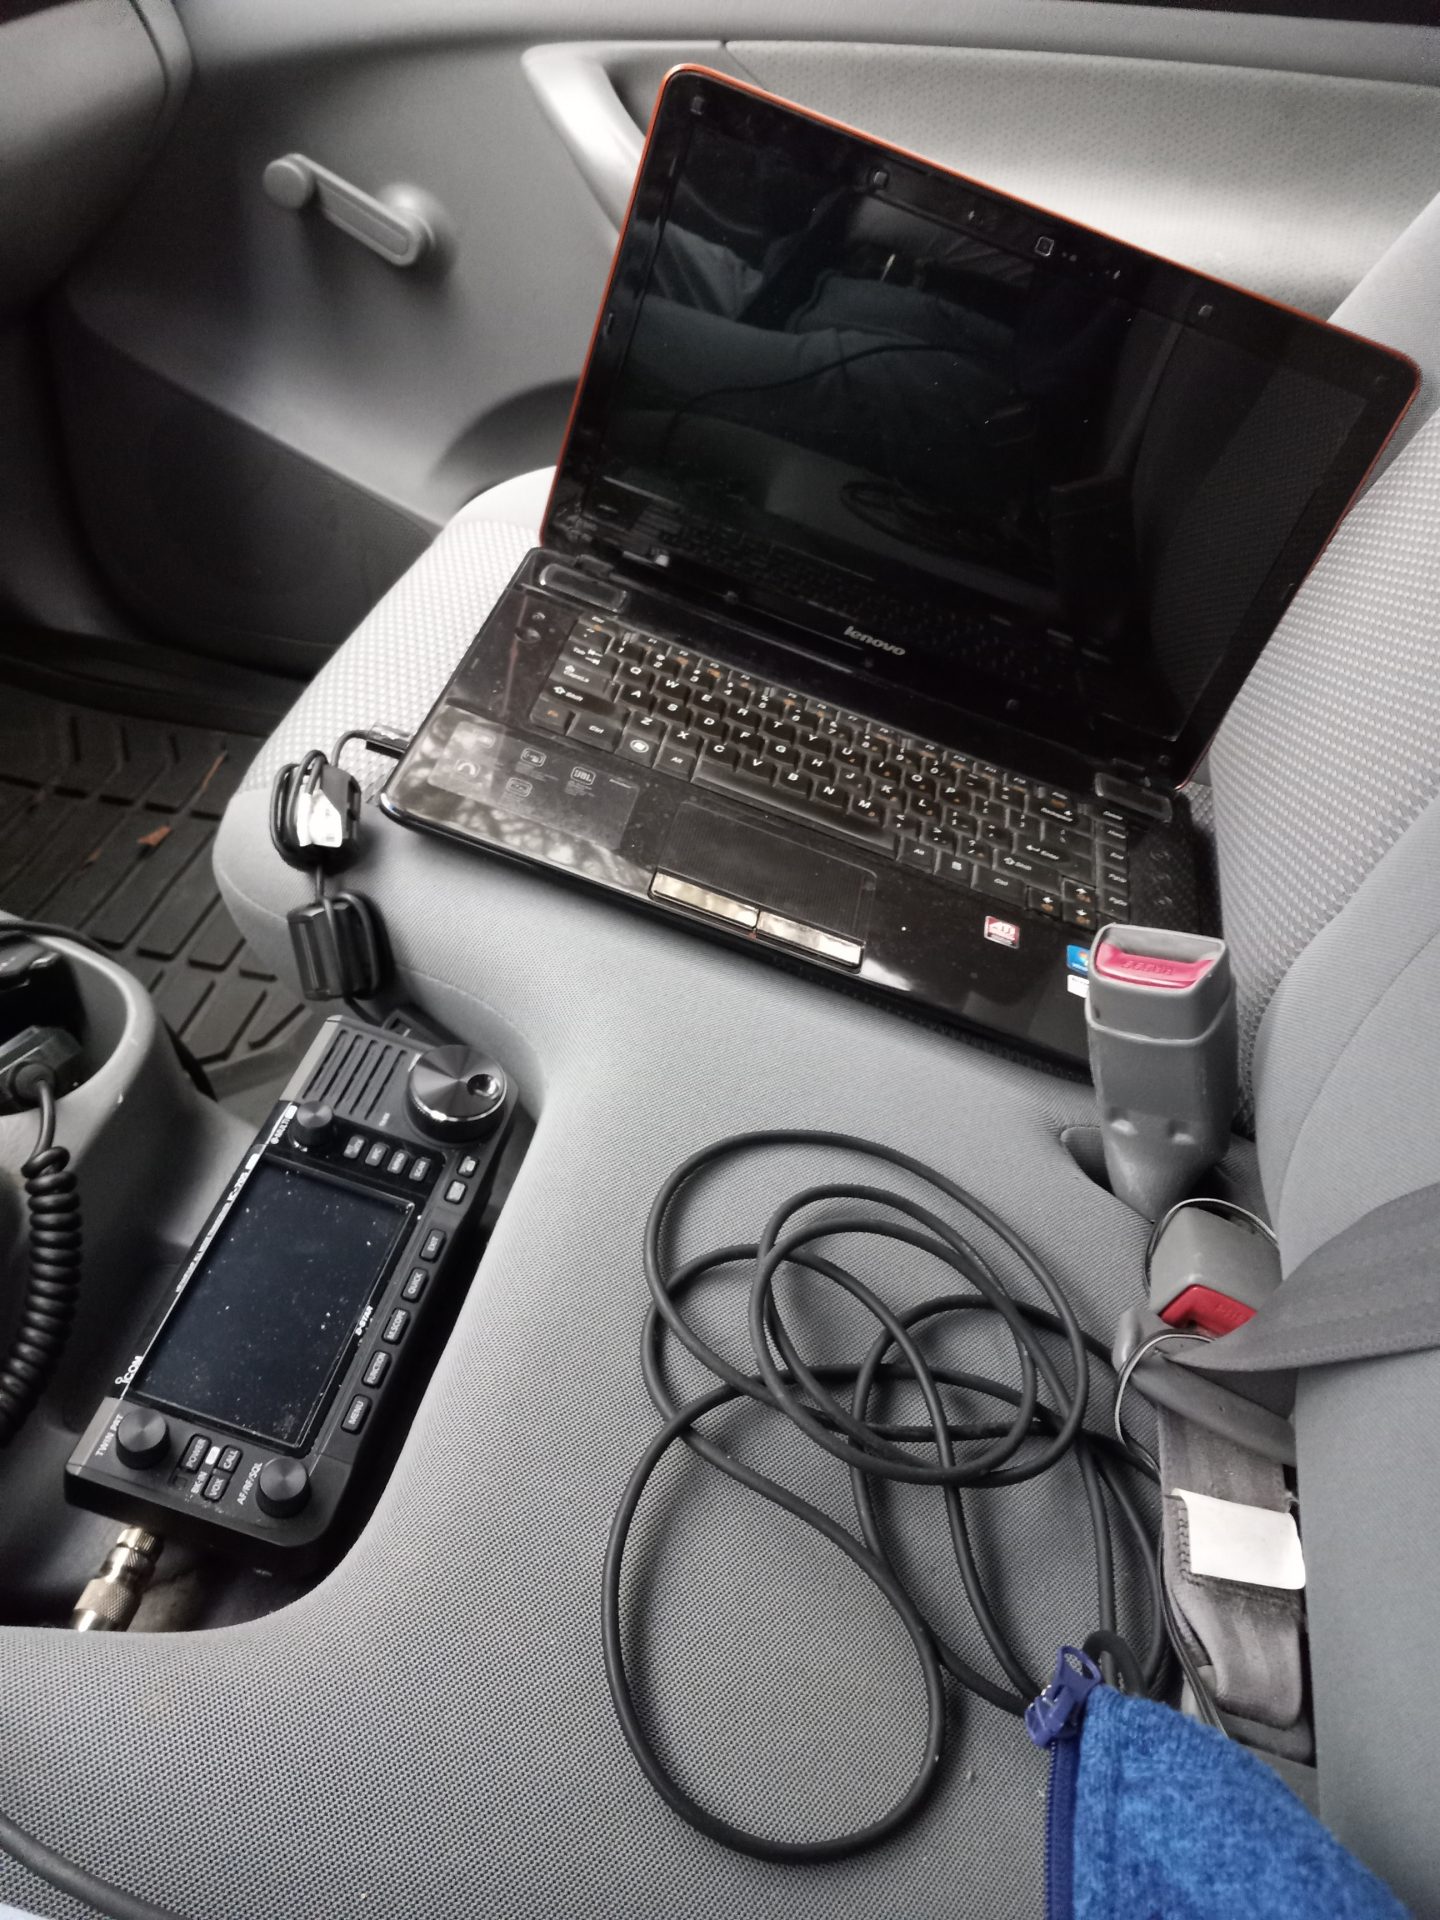
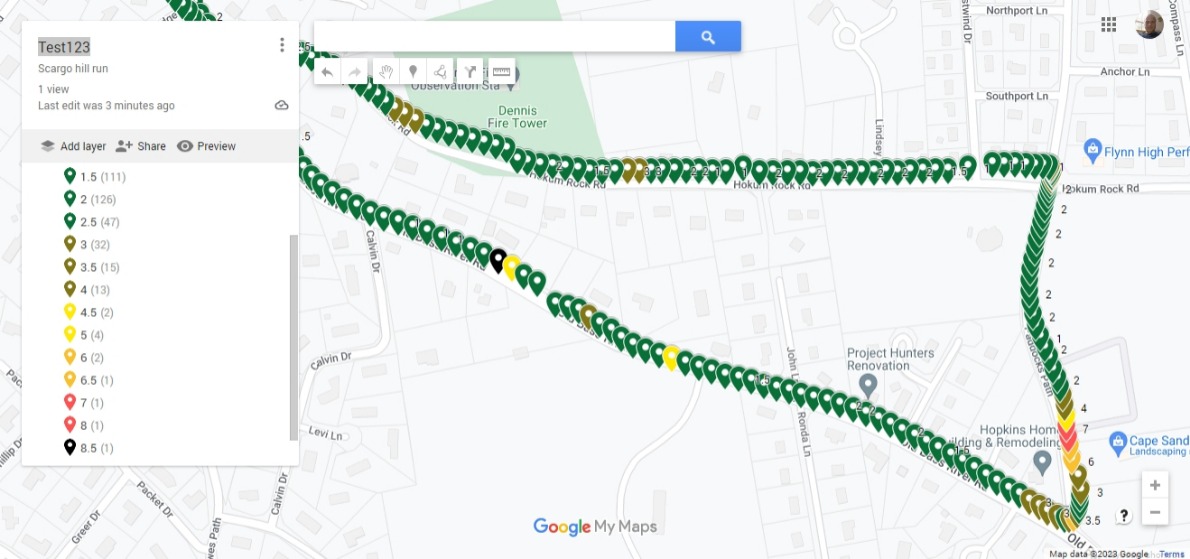
When you complete a run, connect to the internet and go to the GoogleMyMaps site. Upload the data file you created into a new map. Look at the data and use color (select style by s-meter) to single out the high noise data points, i.e. s1-s5 colored green, s5 – s7 colored yellow, s8 and higher colored red. I used a slightly different set since I wanted a bit finer scale. https://nediv.arrl.org/wp-content/uploads/2023/12/rfi-software-test-run.jpeg
Once you’ve identified a problem location, the use of the team VHF/UHF log-periodic to find the specific pole and an acoustic dish (I use an MFJ dish) to find the particular faulty component are the last steps.
I’ll refine this process with the teams’ inputs as we go forward but my testing so far is very positive and I believe that Jeff, W4DD, has provided us with a valuable tool for finding powerline RFI.